Slow server response time? Trace the path before changing hosts.
A slow first response can have several causes. Separate redirects, network delivery, caching and application work before picking a fix.
 A field note on infrastructure
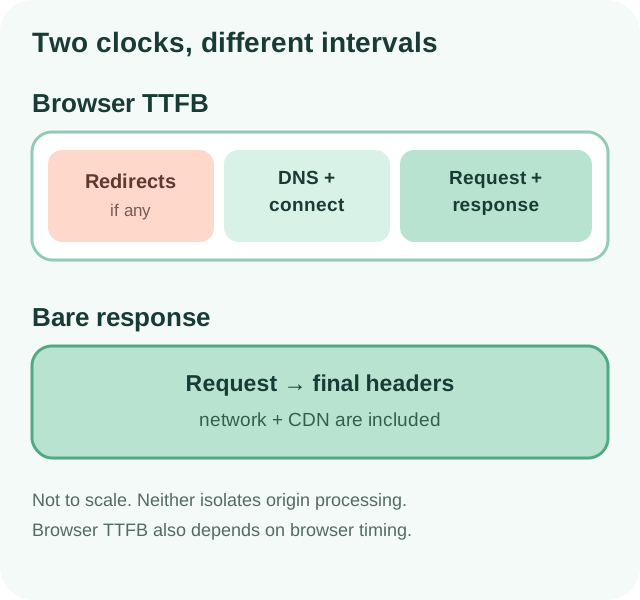
- High browser TTFB can include redirect, connection setup, DNS and server work; no single timing identifies the cause.
- Bare measures elapsed time from its HTTP request start to final response headers; the network and CDN are included.
- Compare the same URL and conditions, inspect redirects and cache behavior, then investigate application work with owner-side tools.
Browser TTFB can include redirect, DNS, connection, TLS and server response time. Bare’s response measurement begins at its HTTP request and ends at final headers.
Source 1 ↗Know which clock you are reading
Time to First Byte (TTFB) in a browser starts with navigation and ends when the first response byte arrives. It can include redirects, DNS lookup, connection and TLS negotiation, plus waiting for the server’s response. It is useful context, but a slow value alone does not say whether the application, network, cache, or connection setup caused the delay.
Bare’s hosting checker records a different server-side interval: from its final HTTP request start until it receives the response headers. It includes the path between Bare’s scanner and the responding edge or server, including network and CDN effects. It does not time a visitor’s DNS lookup, equal browser TTFB, isolate origin processing, or benchmark a host worldwide. Bare’s separate DNS safety checks help validate the destination; their duration is not visitor DNS latency.
Check redirects and cache behavior first
Use the exact page visitors open, not only the final destination. An extra redirect can add a round trip. Compare the first URL with the final one, then review whether a CDN or application cache serves a repeat request. A cache status header can help, but confirm that cached content is current and suitable for every user; personalized responses must not be shared incorrectly.
Illustrative example: a visitor opens http://www.example.test, which redirects to HTTPS and then to the bare hostname. The final page measures 180 ms after the last request, while the whole navigation takes longer because it made two trips first. On a repeat request, a public static page may be served from a nearby cache; an account dashboard may still need dynamic application work. These figures and hostnames are illustrative, not a Bare result or expected improvement.
Repeat, compare, then investigate
Compare the same canonical URL over time and note status, final URL, response headers and whether the result was cached. Reopening a saved Bare result is not a fresh measurement: use its observation date and wait for the checker cache to expire. A cold dynamic page is not directly comparable with a warm static asset. If fresh observations repeatedly show slow final headers, the owner can inspect application traces, database waits, upstream calls, queueing and cache configuration. If only one route is slow, look for work unique to that route before changing providers.
Use browser field data or a lab trace to understand what visitors experience. The lab shows a controlled run; field data reflects eligible real visits when available. Bare’s one scanner location is one bounded observation. Neither that number nor a score proves that a host caused a performance issue or that switching hosts will fix it.
Choose the smallest testable change
Fix avoidable redirect hops, verify cache rules, and profile slow server work with the site owner’s deployment tools. Change one thing at a time and repeat measurements under comparable conditions. Keep a record of the exact URL and response behavior so improvements do not trade speed for stale pages, broken sign-in, or incorrect user-specific content.
Your next-step checklist
- Record the exact starting URL, final URL, status and response headers.
- Check for unnecessary redirect hops and repeat requests with a safe cache test.
- Repeat measurements under comparable conditions before drawing a conclusion.
- Ask the site owner to profile application, database and upstream work when headers remain slow.
- Use field or browser lab data for visitor experience; do not treat one scanner result as causal proof.
Sources & further reading
- 1
- 2